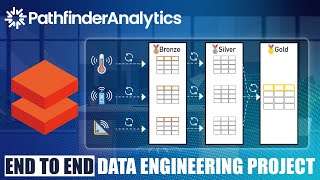
In this hands-on demo, we build a production-grade real-time streaming ETL pipeline on Databricks using Delta Live Tables (DLT).
You’ll see how to ingest synthetic IoT data into Bronze tables, enrich with static bridge metadata in Silver, and compute 10-minute windowed aggregates (average temperature, max vibration, max tilt) in Gold—complete with watermarks, stream-to-static and stream-to-stream joins.
🔗 Links and Resources
- Project Repository: https://github.com/pathfinder-analytics-uk/Bridge-Monitoring-Streaming-Pipeline-with-Delta-Live-Tables
- DLT Documentation: https://learn.microsoft.com/en-us/azure/databricks/dlt/
- ThreadPoolExecutor: https://docs.python.org/3/library/concurrent.futures.html
📚 Udemy Courses (Discount Applied):
- Azure Databricks and Spark SQL (Python): https://www.udemy.com/course/azure-databricks-and-spark-sql-python/?referralCode=C61A322D26568C4E5755
- CI/CD with Databricks Asset Bundles: https://www.udemy.com/course/cicd-with-databricks-asset-bundles/?referralCode=D7CC9D7AF4003300A457
- dbt on Databricks: https://www.udemy.com/course/dbt-on-databricks/?referralCode=DBF2E8D7E42E2E63E261
🌐 Add me on LinkedIn: https://www.linkedin.com/in/malvik-vaghadia/
⌚ Timestamps
00:00 Introduction
01:27 What is DLT
04:17 Project Overview and Solution Architecture
07:59 Azure Set Up
10:35 Project Code Structure
10:55 Synthetic Data Generator
18:45 Running the Data Generator Notebook
22:41 Bronze Notebook
25:26 Silver Notebook
29:28 Gold Notebook
34:27 Creating the DLT Pipeline
44:20 Summary and Recap